
Agflation: the costly evolution of British farming
Wed 09 Jul 2025
The level of economic change in the UK agricultural industry since 2020 should not be understated. First came the complications of navigating Brexit, then a global pandemic. These two factors in combination with war in Europe which swiftly followed have heaped pressure on farmers both domestically and globally.
The fallout from these events has diminished, so how does the UK agricultural industry shape up today compared to the wider economy? In the decades since Brown&Co was formed in 1993, are farmers better off today compared to food producers in those early and intervening years, or has their lot worsened?
Three indices, one story
By comparing the Agricultural Price Index (API) with the Producer Price Index (PPI) and Consumer Price Index including owner occupiers’ housing costs (CPIH), we get an indication of how the farming industry sits alongside other sectors. These three indices represent the early, midpoint and final stages of the supply chain; whilst the API gives a snapshot of the economic position at farm level, the PPI acts as a tracker for factory gate prices and the CPIH as a core element of domestic monetary policy.
All three indices are linked, yet reaction times vary greatly. Take milling wheat as an example. The global commodity market may drive up prices due to lower supplies and British farmers then see output prices rise, increasing the Output API. However, increased energy costs will move the price of fertiliser, sprays and fuel costs, making the Input API rise. These changes often occur very rapidly, are reactionary and directly affect the income and economic viability of an individual farm.
With crop prices up, a mill now pays more for wheat. To the mill, this reflects a rise in the PPI for inputs. In turn, the mill increases the price of flour to pass on that difference, pushing up Output PPI. In a similar fashion, a baker pays more for flour and therefore the cost of producing bread, biscuits and cereals rises. This highlights the level of cost pressure within the supply chain and foreshadows changes ahead for consumers.
With retailers stocking their shelves at greater cost, the consumer bears any final price increase passed to the final point in the supply chain. The CPIH captures the final rise in the price of bread, pasta and baked goods stemming from the shift in milling wheat prices.
Putting these three indices side-by-side shows the overall trends between 1993 and 2024.
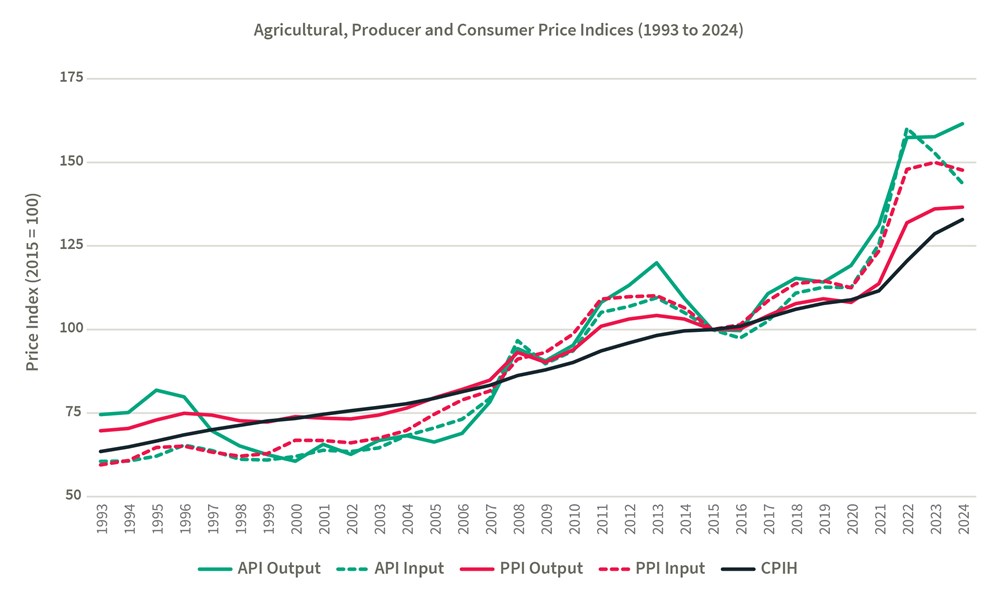
During this period of just over 30 years, the Output API has increased by 117%, yet the changes to its constituents vary considerably. Wheat, barley and poultry have increased by 57.4%, 46.4% and 47.4% respectively, representing more stable markets with intensive production efficiencies. Meanwhile, potatoes have experienced a growth of 546% since 1993, and sheep and lamb 213%, cattle 122%, and pigs 102%.
Broadly speaking, cereals and oilseed are an exception as prices have fallen since the peak seen when Russia invaded Ukraine in 2022. Prices of potatoes, sugar beet, vegetables, fruit, livestock and livestock products, except for milk and wool, have all climbed.
Manufacturing output (PPI) has grown by 96% between 1993 and 2024 and by 26% since 2020, compared to 36% for all API output, showing that agricultural prices have on average grown by more over time and as a result of shorter term shocks.
On cost of production, the Input API increased by 137% between 1993 and 2024. Not only does this show that costs have inflated more than output over the long term, but input prices also grew faster from 2021 to 2023, squeezing margins. However, 2024 total inputs were 10% lower than the 2022 peak, showing the drop in agflation as fertiliser, feed and fuel costs decreased. The exceptions are electricity, which remains volatile, and veterinary services, reflecting that sector’s challenges with rising labour and equipment costs.
The Input PPI rose by 148% between 1993 and 2024. When the agricultural input index increased by 28% between 2021 and 2022, PPI inputs were only 20% greater on average. However, the cost level reached in 2022 has been more sustained and actually peaked in 2023, highlighting the delay in inflation at the manufacturing level. The drop in agricultural input prices has not been replicated in this index.
Lastly, the CPIH shows that average consumer prices are more than twice their 1993 value. Between 2020 and 2024 the index increased by an average of 5% each year - the most significant year-on-year inflation was around 8% between 2021 and 2022.
The relationship between the API and the CPIH is clearly changing. From the mid-1990s until 2008, when the effects of the financial crash were being fully felt, the CPIH remained ahead of the API. Since 2008 this has flipped, with agricultural inflation much greater than that experienced at consumer level. Years in which geopolitical and weather-related shocks occur clearly exacerbate the divide, but what is clear is that the gap is widening.
On the one hand, CPIH inflation affects the living costs of a much larger group, especially when prices are outpacing income growth. Annual inflation since 2020-21 has been well ahead of the UK Government’s official inflation target of 2%. Yet compared to agricultural inflation, there is far less volatility from external market shocks and a much smoother, more stable index. In contrast, farming must deal with the earliest and immediate consequences of supply and demand shocks, futures markets, currency changes and trade disruptions. As price takers, farmers lack the ability to pass on any cost changes and can be squeezed at both the output and input end of production. Changes are experienced directly by farm businesses, coming at a pace which hampers the ability to plan as production and sales will, and must, continue regardless.
Familiar fields, changing costs
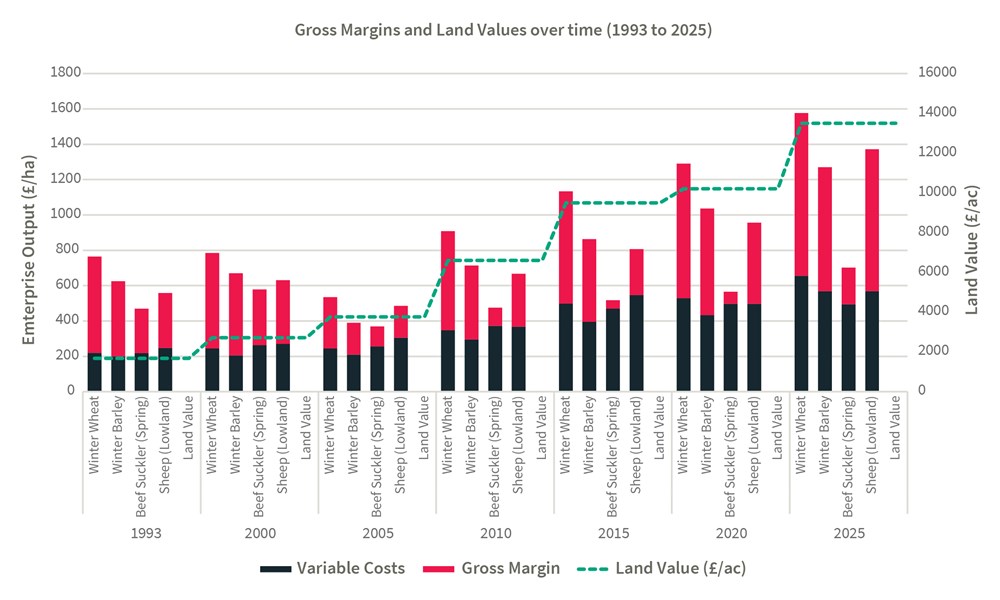
Looking back through past editions of the John Nix pocketbook, the changing rate of return is plain to see. When Brown&Co was formed in 1993 the prices of winter wheat and barley were forecast to be around £85-£90 per tonne - factoring in area payments and variable costs, the average farmer would be aiming for a gross margin of around £545/ha (£221/ac) for wheat and £425/ha (£172/ac) for barley. At this time, the purchase price of farmland in England was around £4,200 per hectare (£1,700/ac). By the start of the millennium, wheat gross margins at £540/ha (£219/ac) had barely moved, whilst land values had already jumped by 60% to £6,700/ha (£2,700/ac).
These numbers pale in comparison to what farmers would expect to pay for land today, with rapid and continuous growth in the market. From 1993 to 2010, land prices quadrupled; from there until the present day, prices doubled again. Deals being made at £13,500/ac in 2025 could reflect a rise in value of 500% or more in 30 years.
Unsurprisingly, gross margins have not kept pace; factoring in yield improvements, higher prices and higher costs, an average feed wheat margin today would be approximately £920/ha, a rise just shy of 70% from 1993, whilst a barley margin of £702/ha is a 65% rise since 1993.
To contrast with livestock, beef suckler spring calving systems had a forecast gross margin of £252/ha (£140/cow) in 1993 and lowland sheep £311/ha (£28.30/ewe). The approach to 2000 saw both of these gross margins improve to £315/ha (£158/cow) and £360/ha (£32.60/ewe) respectively. Neither suckler cows nor sheep saw an improvement for a considerable time according to the John Nix averages; in the case of beef sucklers, the current rise in prices puts the gross margin at £208/ha (£138/cow) in 2025, still below the margin expected in 1993. Meanwhile, lowland sheep have seen a marked improvement, now forecast at £803/ha (£89/ewe) in 2025.
 There are two clear takeaways here: firstly, price inflation and yield improvements have not outperformed cost inflation. While the gross margin per hectare for cereal crops may be growing over time, the conversion from output to gross margin is lower in 2025 than in 1993. The same can be said for suckler beef herds, whilst for sheep flocks the results are less clear. Bear in mind that these are only gross margins, so do not begin to take account of inflation in labour, fuel, repairs or replacements that impact bottom line profit.
Secondly, the rate of return on farmland has been eroded by the colossal rise in land prices. For the sake of simplicity, if we assume no increase in overheads from an arable land purchase, a farmer buying land in 1993 would have seen a return on investment from a wheat crop after perhaps seven or eight years. In 2025, this would take nearer to 35 to 40 years. Investment asset values aside, the opportunity to purchase land to increase profit from farming has declined further and further over time.
Weathering the storm
Figures from the past show us that agricultural inflation has been consistently more volatile than overall UK inflation. Between 1993 and 2021, the highest annual rates of CPIH inflation were 3.5% in 2008 and 3.8% in 2011 following the financial crash; those two years saw agricultural inputs inflate by 17.3% and 11.5%. The 2022 spike saw the CPIH up by 7.9%, but agflation at 34.7%. While the nation’s economy has measures in place to ease and control inflation to protect consumers, British farms operate within a globally influenced marketplace and are therefore far more susceptible to dramatic upward and downward swings. There may have been some stability in the API so far in 2025, however, this does not hide the fact that prices remain at historically elevated levels.
Looking ahead, we live in an increasingly unpredictable world and this weighs heavily on the global economy and will continue to directly and indirectly put pressure on UK food production. Conflict, shifting trade policies and climate change all mean regular yet random shocks in the sector. While no stage of the supply chain is shielded, vulnerability in farming is greater than it is for larger companies, manufacturers and consumers. With profitability dictated by input volatility, limited pricing power and the inherently long production cycles and cashflow seasonality, agricultural businesses are far less able than other industries to buffer or mitigate the financial challenges.
Despite the uncertainty, the pressures of agflation can be managed. With futures contracts and buying groups, tools are available to fix prices, helping to ease instability. Diversification, grants and schemes can also spread or reduce risk. But the foundation starts with business management, financial planning and cashflow analysis to identify areas of risk and strengthen the future position, whatever a farm’s goals may be.

Keep updated
Keep up-to-date with our latest news and updates. Sign up below and we'll add you to our mailing list.