
Farm subsidies in Europe: the varied role of government support
Fri 05 Dec 2025
Agricultural subsidies paid from governments to farm businesses aim to supplement incomes and help stabilise profitability against market fluctuations, rising costs and climate volatility. For the farmer, the subsidy provides a dependable source of income, which may make the difference between profit and loss. For the government, subsidies benefit the rural economy but also provide an opportunity to shape and manage political priorities, such as food security, environmental targets, food prices and competition.
In the UK, as policies are shifting, more strings are being attached to subsidy mechanisms, particularly apparent in England with the complete removal of direct subsidies. Given how unpredictable farm support has been since Brexit, we look at how payments are managed in other European nations, and examine whether UK farmers receive less support than farmers overseas.
England’s policy shift
Under the Common Agricultural Policy (CAP), in 2018 UK farmers received around £3.5 billion per year; 80% was for direct payments under the Basic Payment Scheme (BPS) which, in England, accounted for an average of 55% of farm business profit. The remaining 20% of the CAP budget was for rural development programmes, such as Countryside Stewardship (CS).
In the same year, the government announced the ‘public money for public goods’ initiative, signalling an end in England to area-based payments in favour of the delivery of environmental goals and benefits. This culminated in the Agriculture Act 2020 and the creation of Environmental Land Management (ELM) schemes.
In 2021, BPS phased reductions began and shifted to de-linked payments in 2024. Meanwhile, we’ve seen various iterations of new schemes, such as the Sustainable Farming Incentive (SFI). There are also schemes that were announced but which never came to fruition, Local Nature Recovery a case in point, and meanwhile there are historic schemes like CS which have an uncertain future.
During the final five years of CAP support, England received an average of £2.141bn per year. Since Brexit, during the transition away from area payments, the domestic Farming and Countryside Programme (FCP) has delivered an average of £2.343bn annually to English farms. Looking ahead, current government spending reviews are set to exceed this, with a commitment to over £2.7bn per year from 2026-27. While this appears to be an increase in spending, the real terms uplift is eroded when inflation is factored in. With no agri-environment scheme currently open for applications, the precise delivery of the budget remains unclear.
| CAP | 2016 £2,024m |
2017 £2,129m |
2018 £2,177m |
2019 £2,222m |
2020 £2,152m |
AV. £2,141m |
|---|---|---|---|---|---|---|
| Post-Brexit | 2020-21 £2,450m |
2021-22 £2,294m |
2022-23 £2,230m |
2023-24 £2,136m |
2024-25 £2,604m |
AV. £2,343m |
| Future Budget | 2025-26 £2,450m |
2026-27 £2,770m |
2027-28 £2,720m |
2028-29 £2,700m |
AV. £2,648m |
This shift in where England’s farming budget is being spent by category can be seen in the graph below. As BPS more than halved in four years, and is soon to drop to zero, agri-environmental payments have more than tripled.

Of the SFI schemes managed by Brown&Co, farmers receive an average of £119/hectare across the whole farm. Prior to phased reductions, the BPS paid around £233/ha on non-Severely Disadvantaged (SDA) land in England. In the Brown&Co sample, SFI payments are therefore worth just over half the historic BPS income. Some businesses are earning well above their BPS income and others only have a few baseline SFI actions, or are supplementing older stewardship agreements.
Despite the spending review announcements, uncertainty remains on how farmers can access the funding. CS schemes due to end on 31 December 2025 have been granted a one year extension, but others will continue to miss out. As BPS income takes a significant drop this year, bridging the gap will be an enormous challenge for many.
What approach are other European nations taking to delivering subsidies?
European Union
Funding for EU farmers is administered under the Common Agricultural Policy (CAP). This has undergone a series of reforms in recent years, the most recent in 2023 when a budget of €307bn was set for 2023-27. CAP now represents around 23% of the EU’s total budget, down from about 40% in 2017, in part due to these reforms and also as other policies develop.
In 2024, €56.2bn was shared between the 27 member states. On average, CAP support represents around 16% of total output across the EU27. Subsidies are split into the “two pillars” for the 2023-27 budget, as shown below.
These tables also show that two thirds of the EU’s CAP budget goes to direct funds and a third to rural development. Whilst Pillar 1 is solely funded by the EU, around 40% of Pillar 2 is co-financed by Member States.
| Pillar 1: EAGF (2023-2027) European Agricultural Guarantee Fund |
||
|---|---|---|
| Intervention | € m | % of CAP |
| Basic Payment | 96,697 | 31.5% |
| Eco-Schemes | 44,713 | 14.5% |
| Coupled Income Support | 23,031 | 7.5% |
| Redistributive Support | 20,094 | 6.5% |
| Young Farmers | 3,407 | 1.1% |
| Cotton Crop Specific | 1,232 | 0.4% |
| Direct Payments (sub-total) |
189,109 | 61.5% |
| Sectoral Support | 9,240 | 3.0% |
| Pillar 1: EAGF Total | 198,349 | 64.5% |
| Pillar 2: EAFRD (2023-2027) European Agricultural Fund for Rural Development |
||
|---|---|---|
| Intervention | € m | % of CAP |
| Environment, Climate and Animal Welfare | 33,212 | 10.8% |
| Investments | 31,379 | 10.2% |
| Areas with natural constraints | 18,716 | 6.1% |
| Cooperation | 11,160 | 3.6% |
| Setting up farms and start-ups | 5,175 | 1.7% |
| Risk-management tools | 4,592 | 1.5% |
| Knowledge and information | 2,073 | 0.7% |
| Technical assistance | 1,865 | 0.6% |
| Specific disadvantaged areas | 830 | 0.3% |
| Pillar 2: EAFRD Total | 109,002 | 35.5% |
There are no standardised payments per area across the EU as Member States are given the power to implement their own rules for funding, providing that they do not distort the Common Market competition or go against EU state aid rules.
Greening payments have been replaced by “eco-schemes” which contribute towards the EU’s environmental and climate goals; whilst non-mandatory, they make up 25% of a claimant’s direct payment.
Cross-compliance has been replaced by more stringent “enhanced conditionality”, which were in part the cause of farmer protest across central Europe in 2024.
Sectoral interventions help specific sectors with collaboration, bargaining power, efficiency and their market position. Whilst this is open to all sectors, the most common are fruit and vegetables, wine and beekeeping.
The Pillar 2 rural development fund allows Member States to design and implement their own schemes to meet domestic farming sector needs. Whilst the EAGF aims to stabilise farmer income, the EAFRD invests in sustainability, competitiveness and social development. As is similar in England, this includes a mixture of environmental schemes with different land management options, as well as grant funding for small to large projects, including LEADER.
Proposals have already been drafted by the European Commission for the post-2027 CAP. These appear to mark a major shift by merging the two Pillars into a single, more flexible fund, with more responsibility pushed to Member States to tailor schemes further. Also mentioned is capped or degressive support for area-based payments, for example a maximum of €100,000 per farm, and the introduction of a Farm Stewardship scheme for management practices and investments.
The graph below shows the average level of subsidies received between 2019 and 2023 by farms in Germany, France and Italy, and the UK’s nearest neighbour, Ireland.
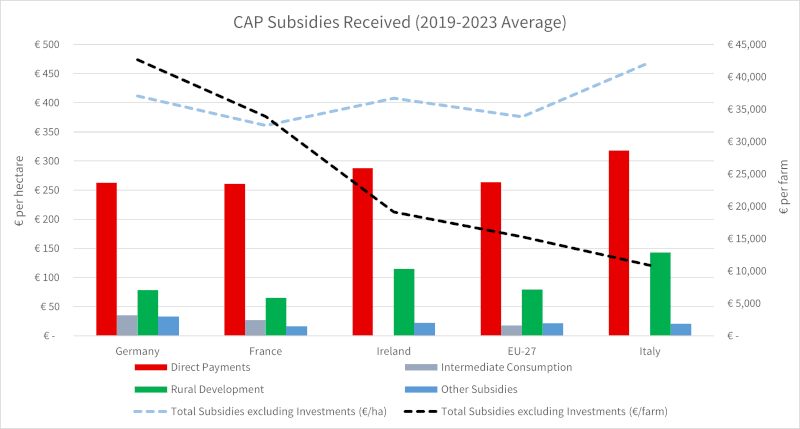
Across the EU27, each farm received an average subsidy of €15,316. In individual countries this ranged from €10,869 in Italy to €42,632 in Germany. While these figures show a disparity, when applied on a per hectare basis they are much more aligned. At 104 hectares, Germany has the largest average farm size and Italy the smallest, at 23 hectares.
EU27 average total subsidies are €376 per hectare. France, at €361/ha, is marginally below this, yet Ireland (€408/ha), Germany (€411/ha) and Italy (€470/ha) all have averages above the EU27.
What is clear is that direct payments under Pillar 1, including area payments and coupled production support, provide the vast majority of the total subsidy income. Meanwhile, rural development subsidies under Pillar 2 contributed only 21% of the total for the EU27 average.
Data for environmental payments shows that across the EU27, 12% of subsidies were derived from agri-environmental schemes during this period but ranging more considerably in some countries - France at 4%, Germany and Ireland both at 15%, and Italy at 18%.
Similarly to the UK, the EU and its Member States are shifting policies in accordance with climate targets and to encourage environmentally beneficial management practices. What is different though is that these are predominantly administered through direct payments and compliance rather than reducing the area payment itself in favour of agri-environmental schemes. From a regulation perspective, this ensures farmers abide by increasingly complex rules but it does not incentivise the voluntary uptake of additional schemes. It remains to be seen how the 2027 CAP reforms will shift this balance.
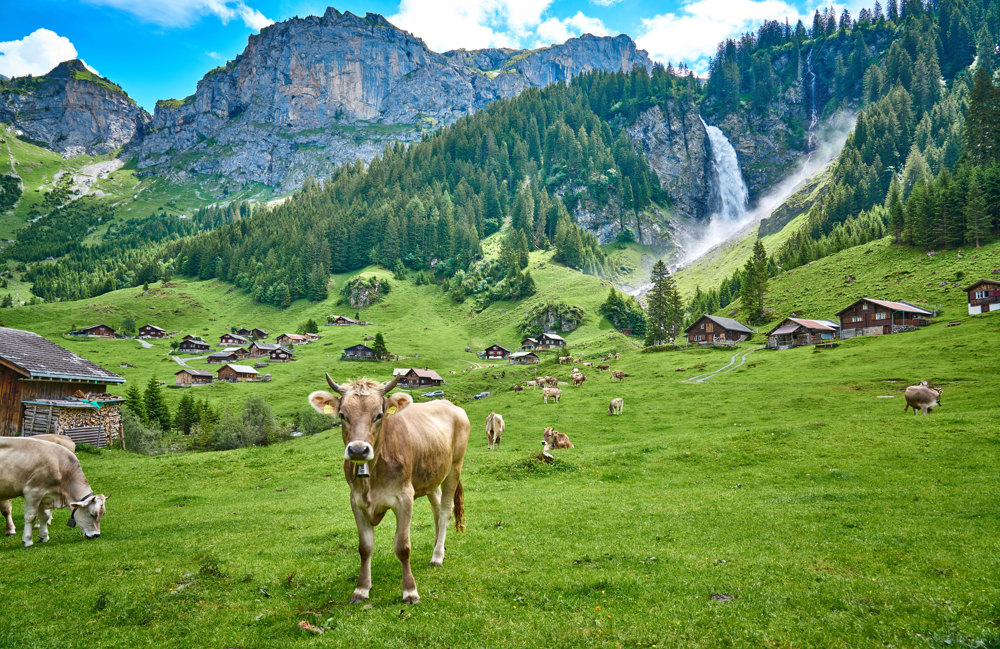
Switzerland
The Swiss Confederation provides an interesting case, given that it is neither a member of the EU or European Economic Area (EEA), nor does it fully participate in the single market, and yet is landlocked by five other EEA nations. Around 60% of the country sits within the Alps, whilst fertile soils in the lowlands help Swiss farmers produce around half of domestic food consumption.
Switzerland’s agriculture lobby is formidable as many politicians have direct links to farming and this feeds through to proposed legislation changes. Surrounded by the Eurozone, Switzerland employs a unique system of tariff rate quotas (TRQs) to protect its 47,000 farmers. Imported goods which can be produced domestically receive a high tariff but these are reduced when Swiss supplies drop below the demand. This creates the opposite effect as in the single market, where higher supplies would see prices fall. As such, Switzerland has the highest food prices in Europe.
Farmers in Switzerland share an annual subsidy budget of 3.4m CHF (£3.17bn). Although the net zero goal of 2050 matches the EU, agri-environmental payments account for only 7% of the subsidy pot. More prevalent is the influence upon land use and production choices. Their subsidies are divided into six categories. Below is an example of subsidy income for a typically sized 25ha lowland dairy farm.
| Farm Size: 25ha | 15 ha Permanent Grassland, 5 ha Arable, 5 ha Biodiversity Areas | |||
|---|---|---|---|---|
| Livestock: 30 dairy cows | ||||
| Subsidy type | Unit | CHF per ha/hd | CHF | GBP* |
| Basic Area Payment | 20ha | 600 | 12,000 | 11,238 |
| Biodiversity | 5ha | 900 | 4,500 | 4,214 |
| Animal Welfare | 30 cows | 500 | 15,000 | 14,048 |
| Summering | 20 cows | 400 | 8,000 | 7,492 |
| Resource Program | 2,000 | 1,873 | ||
| Landscape Features | 500 | 468 | ||
| Total subsidy | 42,000 | 39,333 | ||
| Total subsidy per ha | 1,680 | 1,573 | ||
*Exchange rate of 1 CHF - 0.94 GBP
As the table above shows, farmers receive a Basic Area Payment of around £562/hectare for arable and grassland. Biodiversity promotion areas such as buffer strips, extensive meadows, and hedgerows receive higher amounts ranging between £375 and £940/ha, for which at least 7% of land must be used. Livestock attract payments per head for animal welfare, for example providing regular outdoor access, and summer alpine grazing. Businesses can also receive income for resources and innovation, including precision farming, emissions reduction and soil management, and payments for landscape or heritage features such as vineyards, orchards and dry stone walling. In the example above, a typically sized conventional dairy farm could receive over £1,500/ha in subsidies, the majority of which is generated from area and headage payments.
Agriculture only accounts for around 0.7% of the Swiss economy, yet around half of farm incomes are derived from subsidies. This level of subsidies means that the farming industry is highly protected from competition but completely dependent upon government support to remain operational. Financial and political pressures are evident, with 800 farms reportedly going out of business each year.
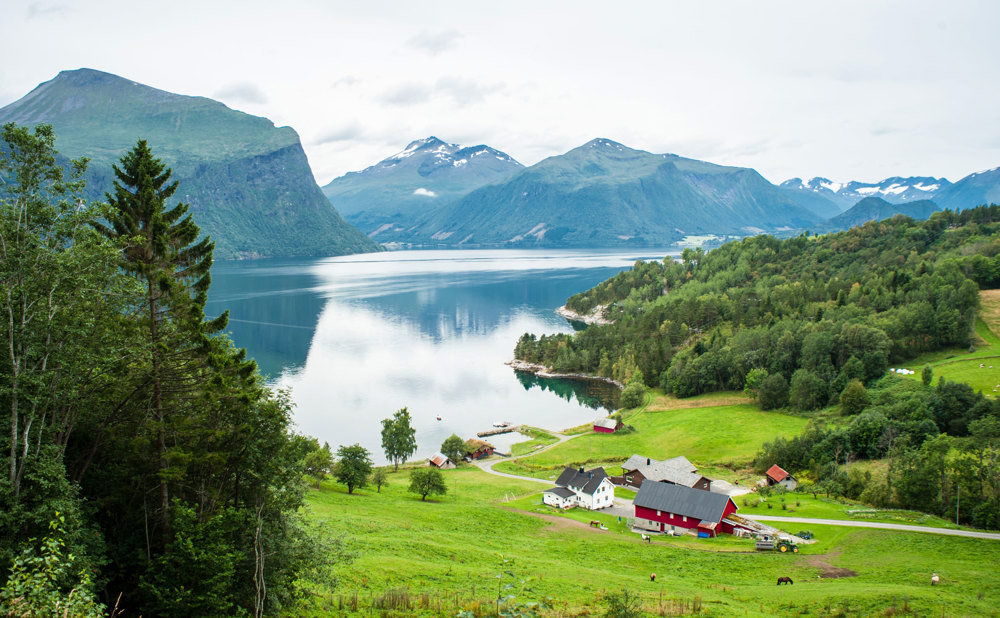
Norway
Sitting just ahead of Switzerland in GDP per capita, Norway is another of the Continent’s economic heavyweights. One key political difference is that Norway is a member of the EEA, granting it access to the EU’s single market. Explicitly excluded from this agreement are agriculture and fisheries. Products from these sectors are instead handled by separate bilateral agreements.
Norway’s climate and geography reduce the ability to establish large-scale farming operations. Compared to milder climates to the south, Norway has a much shorter growing season. While over 60% of England’s land area is farmed, only 3% of Norway is suitable for food production, and only a fraction of that appropriate for cereals and vegetables. The cost of food in Norway is therefore much higher.
Despite these challenges, the Norwegian government is supportive of small farms in rural regions, valuing their social and cultural importance. Integration into the CAP would expose Norway’s farmers to insurmountable competition from lower cost EU producers. TRQs therefore apply, for example 331% for meat products, 318% for dairy products, and 220% for cereals. Full food security is impossible so tariffs are focused on products that are feasible to produce but may be zero on other imported goods.
With such high costs of production, Norwegian farmers received the highest relative levels of government support within the OECD (Organisation for Economic Co-operation and Development) - between 2021 and 2023 it accounted for 49% of total income. Given the numerous challenges, farmers expect government intervention to maintain profitability. For many countries, propping up small, unviable businesses is seen as economically inefficient yet in Norway there exists an accepted balance between high food prices and the preservation of the social, cultural and regional landscape.
To illustrate the subsidies received by a Norwegian farmer, the example below is for a typically sized mixed farm.
| Farm Size: 27ha | 20 ha Permanent Grassland, 5 ha Arable, 2 ha Woodland/Other | |||
|---|---|---|---|---|
| Livestock: 15 dairy cows and 40 youngstock | ||||
| Sheep: 100 breeding ewes | ||||
| Subsidy type | Unit | NOK per ha/hd | NOK | GBP* |
| Basic Area Payment - | ||||
| Forage | 20 | 12,000 | 240,000 | 18,000 |
| Basic Area Payment - | ||||
| Cereal | 5 | 18,500 | 92,500 | 6,938 |
| Sheep | 100 | 581 | 58,100 | 4,358 |
| Cattle | 55 | 2,000 | 110,000 | 8,250 |
| Regional/Structural Payment | 5 | 3,100 | 15,500 | 1,163 |
| Environment/Climate | 10 | 2,500 | 25,000 | 1,875 |
| Relief Worker Grants | 30,000 | 2,250 | ||
| Other Subsidies | 15,000 | 1,125 | ||
| Total subsidy | 586,100 | 43,958 | ||
| Total subsidy per ha | 21,707 | 1,628 | ||
*Exchange rate of 1 NOK - 0.075 GBP
As with the EU and Switzerland, the central elements of subsidies in Norway are area and headage-based payments. Regional and structural payments aim to top-up production on more demanding terrain and on smaller holdings. Until now, environmental practices have been a minor element of the subsidy allocation, targeted at practices that benefit water quality, biodiversity and soil health. However, the annual Agricultural Agreement is now elevating climate to a top tier priority and will represent a third of the budget going forward. Not only will this provide opportunities for more environmental management but will enforce a 22% reduction in the national milk quota from 900,000 to 700,000 litres. Also coming to the fore is a fund for escalating inputs and inflation pressures to bridge the gap between expected and actual incomes.
As well as conventional subsidy funds, Norwegian farmers can also receive grants for relief workers to cover staff illness or parental leave for example, indirect tax advantages, preferential loans and other project-based funding. The example above shows that a typical farm could receive over £1,600/ha in government support, considerably higher than in England or the EU.
Summary
Following the exit from the CAP, the UK had the opportunity to fashion its own domestic policies. As a devolved responsibility, of the four nations England has taken a more drastic approach to phase out direct payments completely. De-linked payments were already a minority share of the 2025 budget and future spending plans show how agri-environmental schemes will soon make up 90% or more of agricultural support in England.
In the EU, the payment mechanisms have remained broadly similar since Brexit, despite various reforms. While there is flexibility for the 27 Member States to design their own schemes, the majority of the payments made to farmers continue to be in the form of direct or area-based subsidies. Environmental compliance is being made more stringent and comes with a greater share of the monetary value. Yet, the roll out of agri-environmental schemes has not yet been as widespread as it is in England.
As non-EU members, farmers in Norway and Switzerland are much more dependent on basic area payments to maintain the financially viability of their businesses. Climate and the environment also feature high on the agenda but are not the mainstay of subsidies.
The role of subsidies in protecting businesses and livelihoods remains vital for UK farmers, but the way in which they are delivered, without area payments and the inconsistent roll out of schemes, makes support much more difficult to access. Commodity market volatility destabilises the backbone of agricultural output, so there is an absolute need to keep schemes and subsidies available for all in a fair and responsible manner. All-out dependence on government support is not sustainable within the UK system, yet it still has a role to play in encouraging environmental protection and supplementing incomes.
Keep updated
Keep up-to-date with our latest news and updates. Sign up below and we'll add you to our mailing list.